Call of Duty: Black Ops 3 is protected by a DRM that, among other things, protects the integrity of the game’s code at runtime.
Reverse engineering those integrity checks has been a personal goal I had for a long time.
In this post I’m going to describe my process of achieving exactly that, so let’s dive in.
Disclaimer
Just a little disclaimer here. The goal of this post is not to encourage piracy. Creating pirated copies is possible without bypassing the integrity checks and has long been done. Neither do I want to encourage cheating or hacking. In fact, the game has a lot of unpatched security vulnerabilities, which make it almost unplayable. Therefore, I hope this post opens up the possibility to get these patched.
Status quo
When patching executable memory of the game, I noticed three things happening: Sometimes the game crashes, sometimes it gets stuck as if it deadlocked and sometimes it just instantly exits with code 0. Depending on which bytes in memory are patched, one of those things happens. This kind of behaviour lead to a chain of assumptions I made.
First, it seemed like there must be multiple integrity checks, maybe even guarding different regions of memory. Depending on which check is violated, the game “dies” in a different manner.
In case this was true (spoiler: it is 🙁), that meant integrity checks could guard each other, so patching one handler would still result in a crash, because a different handler would detect the violation. To be successfull, one therefore has to patch all of the checks, otherwise the game would still die.
Because the game sometimes deadlocks, I thought the penalty is not an immediate action the game takes. Rather, I assumed, the result of those integrity checks is integrated into the control flow of the execution.
So on a high level, the evaluation might be something like this:
if(someGameCondition && isIntegrityCheckValid) {
    doThis();
} else {
    doThat();
}
That means, the outcome of the integrity check is simply calculated into existing logical conditions of the original code. And if integrity is violated, the execution simply takes a different path at some point. Which can pretty much cause anything, but will eventually lead to the game behaving incorrectly and thus dying.
I don’t know whether this is actually the case, but when looking at dumps of the crashes, I was not able to find anything that looked like a part of an integrity check.
This made me assume that the check and the penalty are likely spread apart at different locations in the code, probably even executed at different times.
Because of all those assumptions, I had the following problems:
Which technique can I use to find and analyze the integrity checks?
And once I did so, how can I start patching them one by one to see whether I’m making progress?
Finding an analysis technique
To discover and analyze the checks, my idea was to place a watchpoint on some piece of code to see who reads it.
As code is usually just executed by the CPU and not actually read as data, such a breakpoint being triggered would mean an integrity check reading the code to verify it.
However, as the game has a protection against debuggers and simply due to the integrity checks themselves, debugging it is not an option.
Therefore, I needed a different technique for analysis.
Note: The first two approaches will describe failures. If you don’t care about them, you can skip to third approach!
❌ Page permissions
The first thing that came to my mind was to abuse page permissions. Memory pages can be executable, readable and writable.
If the protection is violated, e.g. when non-executable memory is being executed, an access violation exception is raised by the CPU. As debuggers are not an option, one has to install an exception handler at runtime through an injected DLL.
In theory, disabling read access to a page would allow tracing all memory reads of said page. Sadly, Intel CPUs don’t support pages being writable or executable, without also being readable.
However, reads can still be traced by disabling page permissions entirely.
This will cause exceptions to be raised for reads and executions.
In an exception handler one can then pass through all the exceptions raised by bad execution permissions, to be left with those related to missing read permissions.
After an exception has been handled, normal execution has to continue. Simply restoring page permissions to what they are supposed to be will not work though. Any memory access happening after the restoration can’t be traced anymore.
To fix this, the idea is to restore the original page permissions, execute only the faulting instruction and then restore the tracing page permissions.
This can be done by using the single step mode of Intel CPUs. In single step mode, the CPU executes exactly one instruction, then raises a single-step exception.
So the process would be as follows:
- Catch the violation to trace the memory read
- Restore original page permissions
- Put the CPU into single step mode
- Rerun the faulting instruction
- Catch the single step exception after the execution of the instruction
- Restore tracing page permissions and exit the single step mode
Depending on the size of the application and the guarded range, this can work fine. With larger applications, this can become horribly slow, especially when executing instructions on the page that needs to be traced. In fact this approach was so unbelievably slow with Black Ops 3, that I quickly dropped this idea.
Related to this approach is emulating the Intel CPU directly. I have shortly thought about doing this, but as I haven’t found many resources and considering the fact that it might not be much faster than the page permission aproach, I also dropped this idea.
❌ Hypervisors
Not being able to decouple execution from read permissions is what made the page permission approach impractical.
However, as stated in my previous post about hypervisor-assisted hooking, this limitation does not apply to Intel VT-X. This means a hypervisor for Intel VT-X can make use of Intel’s second level address translation, EPT, to achieve the desired behaviour of intercepting memory reads.
Just like page permissions in the ordinary address translation layer, EPT adds a second translation layer with its own set of permissions. With the exception that executable pages don’t have to be readable (AMD doesn’t allow that, so Intel only ¯\_(ツ)_/¯). For a better explanation on how Intel’s EPT works, feel free to read my previous post.
To test this, I integrated a watchpoint mode into my hypervisor. The way it works is similar to how EPT-hooking works. It translates virtual pages of a process to physical pages and generates corresponding EPT entries with permissions set to execute only.
Once an EPT violation vm exit occurs, I switch the permissions back to the original ones.
However, restoring page permissions is not yet implemented correctly. The way I do it is by resetting all page permissions upon an EPT violation for all pages except the one that triggered the violation. The less pages are being traced, the less restorations occur. This is definitely not ideal, as accesses can be missed if permissions are not locked soon enough.
I’m sure the single stepping behaviour can also be implemented on hypervisor level, probably by handling the exception/NMI vm exit, but I have not found the time to look into that.
Another weakness of my implementation is that I use a single global page table, instead of one per core. This was advantageous for EPT hooks, but can potentially lead to additional races in multithreaded scenarios when used to trace reads.
From a practical side, my hypervisor is hard to use. Writing a stable hypervisor is an extremely difficult task. Considering I’m new to this field, it is especially hard for me. Although my hypervisor got pretty stable over time, it still bluescreens here and there.
This can be exteremely tedious. Combined with the races mentioned above, this approach was not that practical.
I had a look at other hypervisor implementations but they either did not fit my needs or had similar, if not worse bugs in them.
I have the feeling that the entire field of hypervisor-assisted reverse engineering still needs time to evolve. The potential is huge and projects like HyperDBG look promising, but are still in their early stages of development and therefore barely usable in practice (at least for what I wanted to do).
Nonetheless, I will definitely continue stabilizing and developing my hypervisor, but for now, a different approach is needed.
✅ Hardware Breakpoints
Hardware breakpoints allow tracing memory reads, writes and executions. This can be done by configuring special debug registers of the CPU.
Sadly, the game detects these, which is why this was not my first approach.
However, I tried getting them to work, which turned out to be extremely simple. The game detects them by regularly calling GetThreadContext to see if debug registers are active.
Hooking that and clearing debug registers worked. As GetThreadContext is an API call and not part of the game’s code, there is no integrity check guarding that function.
While, again, reads can not be traced individually, they can be traced together with writes, without affecting the overall execution. As executable pages are normally not written to, tracing writes as well is no relevant performance factor.
When such a breakpoint is triggered, a single-step exception is raised, which can be caught by a debugger or in this case through the exception handler of the injected DLL.
However, there are a few limitations:
- Debug registers are local to a thread, meaning hardware breakpoints must be enabled separately for each thread of a process
- Intel CPUs support only up to 4 simultaneously active breakpoints (per thread)
- One breakpoint can only trace up to 8 bytes of consecutive memory, but not more (as far as I know)
As mentioned above, debug breakpoints can easily be detected by reading the state of the debug registers using for example GetThreadContext. Some DRMs even use debug breakpoints as obfuscation mechanism to hide execution flow. This can make them unusable for analysis.
Older Call of Duty titles used to do that.
However, even with those limitations in place, they were powerful enough to analyze the integrity checks of the game.
Analyzing integrity checks
Now that I had an analysis technique at hand, discovering and analyzing the integrity checks was the next task.
To do that, I placed a read/write hardware breakpoint somewhere in the code. The exception handler in fact triggered and lead to this piece of code:
One byte at rax is read, which is the memory where my breakpoint was placed. That byte is zero extended and xored with [rbp + 58h].
The xor result is then stored again in [rbp + 58h].
This in fact seems to be a part of the calculation of some kind of 4 byte checksum.
[rbp + 58h] seems to point to the intermediate calculation result.
My assumption was that at some point the value must be evaluated and compared against the correct checksum.
To find that location, the idea was to place a breakpoint at [rbp + 58h].
To do that, I adjusted the exception handler. Once the initial breakpoint triggers, I remove it and evalute [rbp + 58h] using the current exception context and place a breakpoint there.
Doing that, the handler triggered quite a few times at different locations. One was here:
This essentially does the same as the first fragment, but on a 4 byte level.
The other checks were similar, either 1 or 4 byte memory fragments were computed into the checksum.
However, the last two break locations were very interesting.
Evaluation
First, let’s focus on the last one:
I expected this to be the one that evaluates the checksum. At first, I was afraid that the [rbp + 58h] breakpoint might be placed on some intermediate memory location and the computation might go on somewhere else and I had to continue tracing there.
However, it turns out, this was the actual evaluation:
The breakpoint triggered at the line with the first red mark. This loads the calculated checksum.
The second red mark loads the correct checksum. Both are compared against each other, where the third mark is.
Two addresses of code paths are then loaded into registers where the next two marks are. The code is a slightly obfuscated, but the last mark choses one of the two locations depending on the result of the comparison. The jump at the end then executes the selected code path. It’s essentially a compressed if-then-else statement.
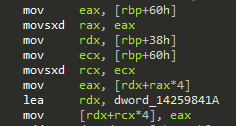
Now let’s have a look at how the checksums are gathered:
The line with the first red mark, mov eax, [rdx+rax*4], loads the computed checksum.
The exception context reveals rax to be zero. This means rdx contains a pointer to the computed checksum.
It can be seen that rdx gets assigned through mov rdx, [rbp+40h].
The correct checksum gets loaded at the second red mark, mov edx, [rbx+rcx*4].
Just like before, rcx seems to be zero. So rbx is a pointer to the correct checksum.
It can be seen that rbx gets assigned through mov rbx, [rbp+48h].
From that we can conclude that offset 0x40 on the stack frame is a pointer to the calculated checksum, and offset 0x48 is pointer to the correct checksum.
We can derive a C struct from that, which starts at offset 0x40:
struct integrity_handler_context
{
    uint32_t* computed_checksum;
    uint32_t* original_checksum;
};
Chaining
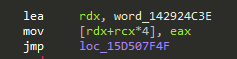
Before thinking about any patching, let’s first have a look at the breakpoint that triggered before the evaluation:
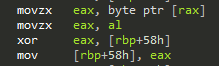
The breakpoint triggered at the line mov eax, [rdx+rax*4], which loads the checksum into eax.
Just like before, rax was zero at that point. So rdx is the interesting value here.
It gets assigned through mov rdx, [rbp+38h]. So at this point, stack frame offset 0x38 turns out to be the integrity_handler_context.
However, the last two lines are very interesting: lea rdx, dword_14259841A loads an address of memory somewhere in the .text section.
The last line, mov [rdx+rcx*4], eax, seems to store the checksum at that location in the .text section (rcx again being zero).
Note that due to the DRM rewriting and decrypting code at runtime, the .text segment is RWX.
I thought about what this piece of code might do. I am still not certain what it does, but my assumption is that it chains different integrity checks.
Let’s imagine patching this integrity handler at evaluation part above, after this code has executed. I might already be able to tamper the code of the game this handler guards. However, because this fragment writes a wrong checksum into a region another check guards, the game still crashes. So the two handlers are chained together. If every guard does that, this might potentially chain all handlers, and thus all memory, together.
Therefore it is not only relevant to patch the evaluation of the checksum, but also the chaining here.
Patching one check
I thought about different ways of patching the checks. Before having analyzed anything, I even tried patching all kinds of memory reads and returning original bytes at patched locations. This is obviously not very efficient.
An ideal solution would be to disable all checks entirely. However, my goal was just to get them patched somehow, so I thought about taking the easiest path:
The easiest path seemed to be to overwrite the computed checksum with the correct checksum right before the chaining, as everything is at hand in the integrity_handler_context.
To non-invasively patch one individual check, I decided to reuse the exception handler with hardware breakpoints.
As soon as the handler triggered at the chaining location, I looked up the integrity_handler_context at rbp + 38h.
From there, I simply overwrote the computed checksum with the original checksum:
auto context_addr = info->ContextRecord->Rbp + 0x38;
auto* context = (integrity_handler_context*)context_addr;
context->computed_checksum = context->original_checksum;
This in fact worked. Patching the byte I initially placed my hardware breakpoint at, I was able to tamper memory of the game for the first time 🥳. At least until the game still eventually crashed after some time. Probably because another check guarded the same region of memory.
Patching all checks
Now that a single check can be patched, the question is, how can all checks be patched? Again, the idea was to hook the chaining parts of all checks to correct the computed checksum.
When looking around, I noticed a few things:
First of all, the integrity_handler_context can move. It is not always located at offset 0x38. Some checks have it at 0x40, some at 0x48 and so on.
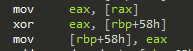
The second thing I noticed is basic blocks of the code can randomly be split into multiple basic blocks, connected by jumps. So fragments may look like this:
While intact blocks look like this:
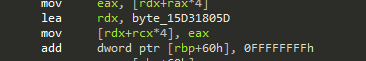
However, the patterns started to stick out:
mov [rdx+rcx*4], eax, followed either by a jmp, if the block is split into two parts, or an add dword ptr ... instruction for intact blocks.
I did some quick pattern scanning and it turned out that all the occurances for those two patterns seemed to be chaining blocks.
The idea was then to simply hook all those locations through pattern scanning and redirect them to an assembler stub that fixes up the hooking and at the same time allows to correct the checksum.
However, if such a hook gets called, how can I find the offset of the integrity context on the stack frame? I noticed two things: The original checksum was always located in the .text section. The calculated checksum always resided in some region on the stack.
So, with that, I wrote a quick and dirty heuristic: I scanned the first 0x80 bytes on the stack. If there was a pointer that pointed to the stack, followed immediately by a pointer to .text, I assume this must be an integrity context. While this might seem unstable, it works just fine.
After fixing a few bugs in my hooks and assembler stubs, I was able to patch 1219 integrity handlers. And in fact the game ran just fine with patches applied anywhere. 🥳🥳🎉🎉
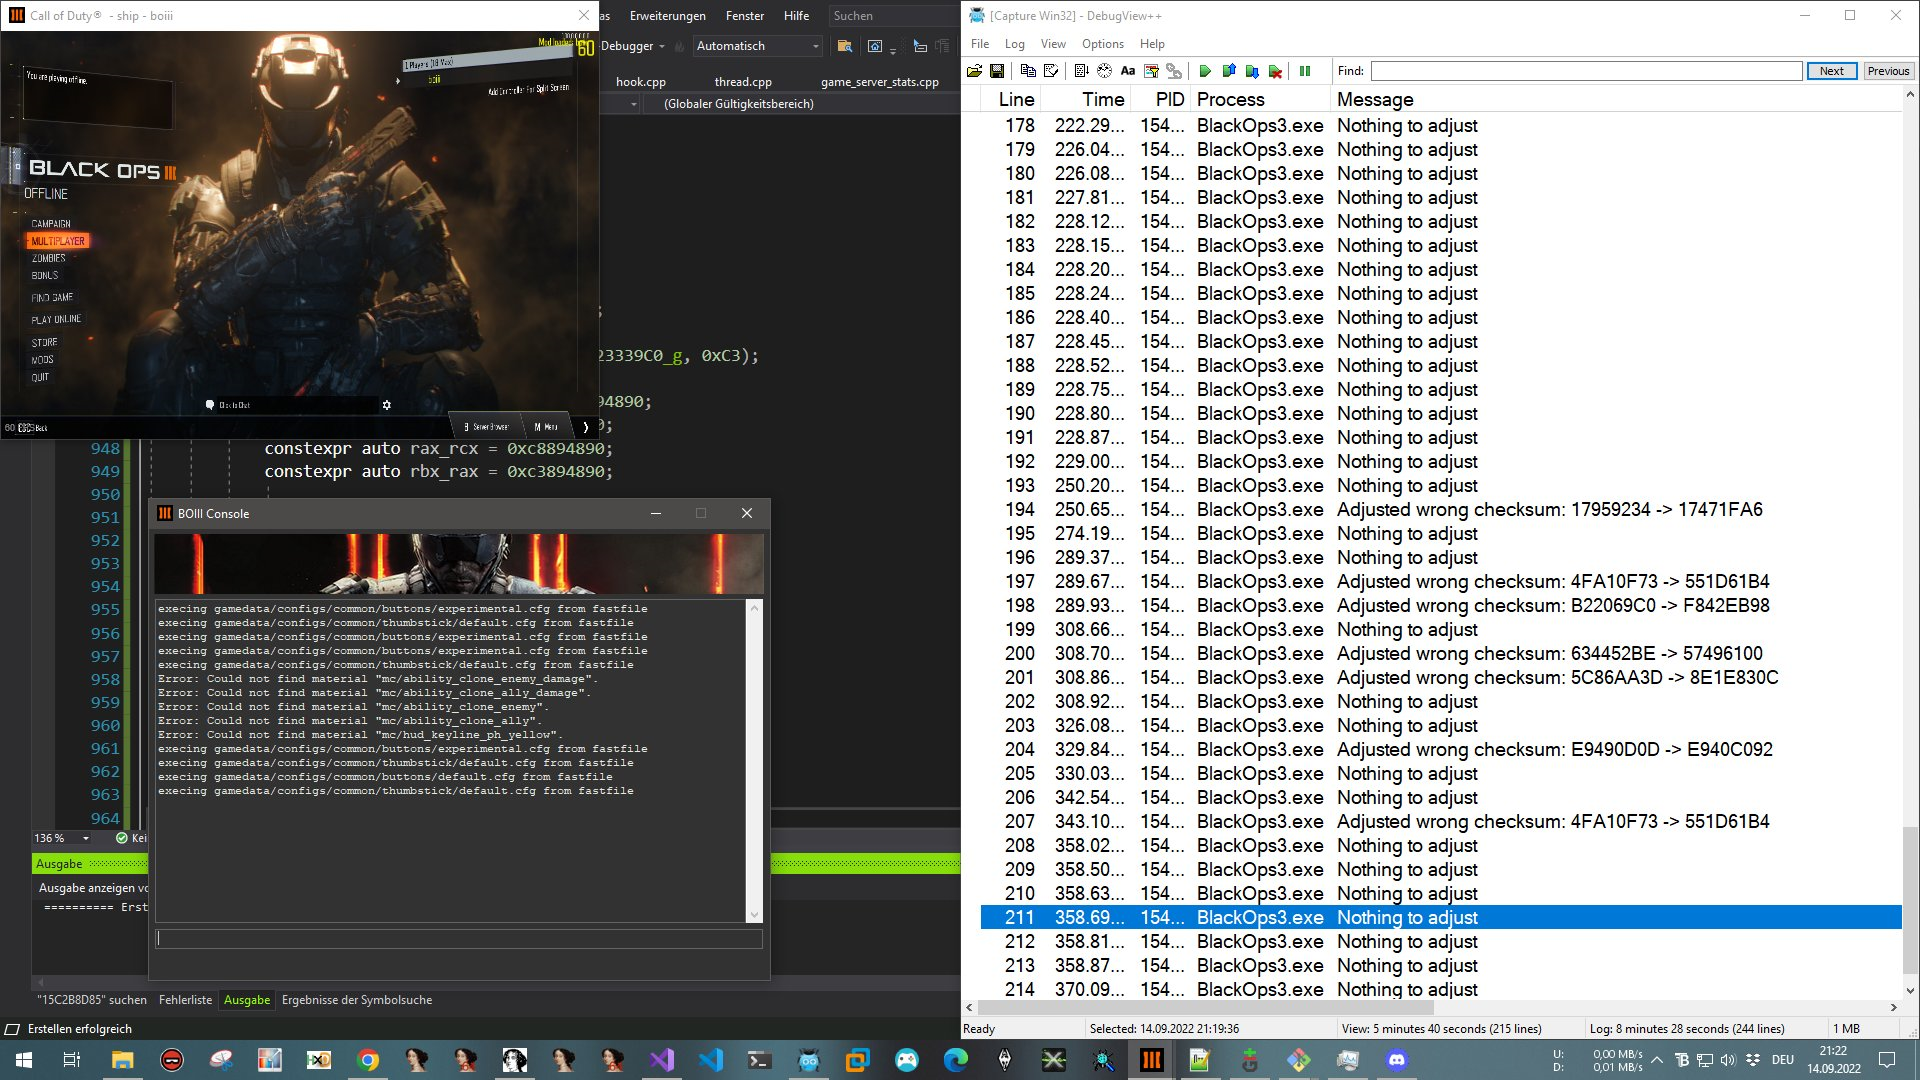
Here is the debug output of my exception handler:

Conclusion
I have to admit, this was a really tough challenge to me. It took me years to achieve that. I always tried to tackle the DRM from time to time, but never found a way to start. Finding the right analysis technique really is the key here.
Looking back, trying hypervisors before using hardware breakpoints might have been a bit overkill, but I did not expect a single patch to get hardware breakpoints to work.
On top of that, I was surprised that patching the integrity checks was possible with only two patterns. I expected a lot more variations, different integrity checks that required a lot more analysis and different patterns, but in the end it is two variations of a single form of integrity check injected 1219 times.
While analyzing, I noticed the checks seem to adjust themselves over time. So they seem to get executed less and less, the longer the game runs. This is quite an elegant way of preserving the performance of the game.
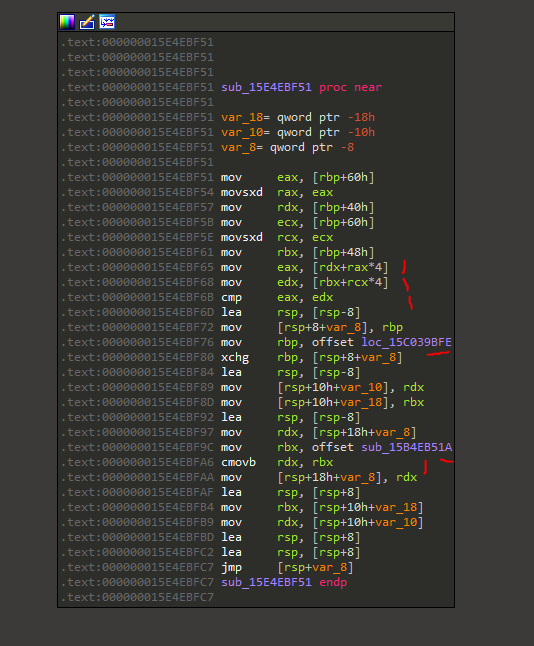
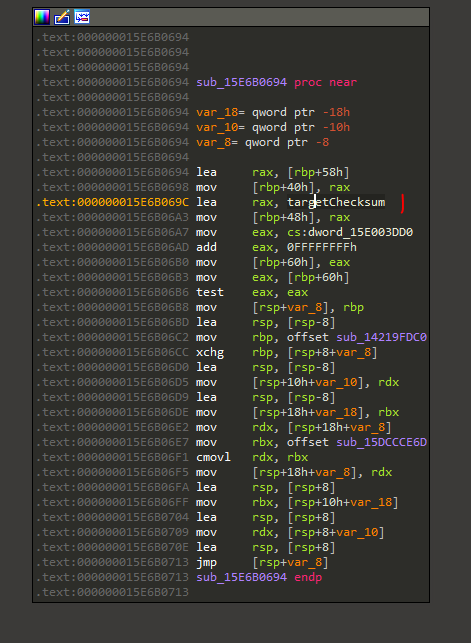
At some point I even found where the integrity checks start. This is where the context is setup:
It might probably be possible to disable the integrity checks all together. However, my patch works, so I was too lazy to look into that.
However, from a DRM developer’s POV, the integrity checks were very effective. On top of that, the runtime adjustments for performance are very elegant.
In general, the protection of the game seems very good to me, as next to having integrity checks, a whole bunch of other protections are applied as well. This makes reverse engineering the game a tough challenge.
In the end, patching the checks was a matter of not giving up. Continuing to gather information and not getting intimidated of what one might uncover.
I’m very happy that I can finally cross that off my bucket list 🥳.